US Market update Aug 18 2024

The US stock market showcased notable resilience last week, despite the release of inflation data on August 14. The Year-to-Year inflation value saw a slight decrease, while other indicators remained unchanged. Interestingly, the market did not exhibit any significant reaction to this news, suggesting that investors may have already priced in these expectations or are focusing on other economic factors.

SPX Index Nearing All-Time High

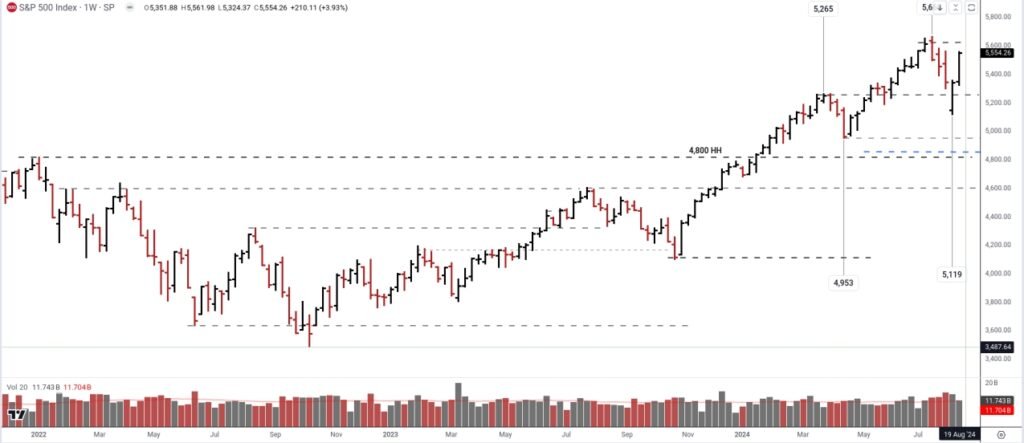
The SPX index, a key benchmark for the US stock market, closed the week nearing its all-time high (ATH) of 5,670. This is a significant recovery, as it has reached the level where a previous sell-off began earlier in August. The rally that started post-sell-off has continued to gain momentum, indicating strong market sentiment. Investors are now closely monitoring whether sellers will reappear at this critical level, which could potentially halt the rally. The market’s performance in the coming days will be crucial in determining if the SPX can push past its previous highs or if another wave of selling pressure will emerge.
NDX and Sector ETFs

The NDX also reached a key level at 19,500, where the last sell-off started. This level is crucial for the tech-heavy index, and its performance here will be closely watched. Among sector ETFs, XLK mirrors the NDX’s performance, indicating a strong tech sector. XLF (Financials) and XLI (Industrials) have been among the strongest performers over the last two weeks, almost erasing the losses from the sell-off that began on August 1. On the other hand, XLE (Energy) appears weaker compared to other sectors, with oil prices closing at the same level as the previous week.

Commodities: Gold and Silver

In the commodities market, gold has made headlines by reaching a new ATH this week, continuing its upward trend. This surge in gold prices is being closely watched to determine if it is sustainable in the long term. Alongside gold, silver is also starting to gain momentum, indicating a broader interest in precious metals. Stocks like AEM (Agnico Eagle Mines Limited) and KGC (Kinross Gold Corporation) are showing promise, likely benefiting from the bullish sentiment in the gold market.

Dollar Weakness and Market Implications

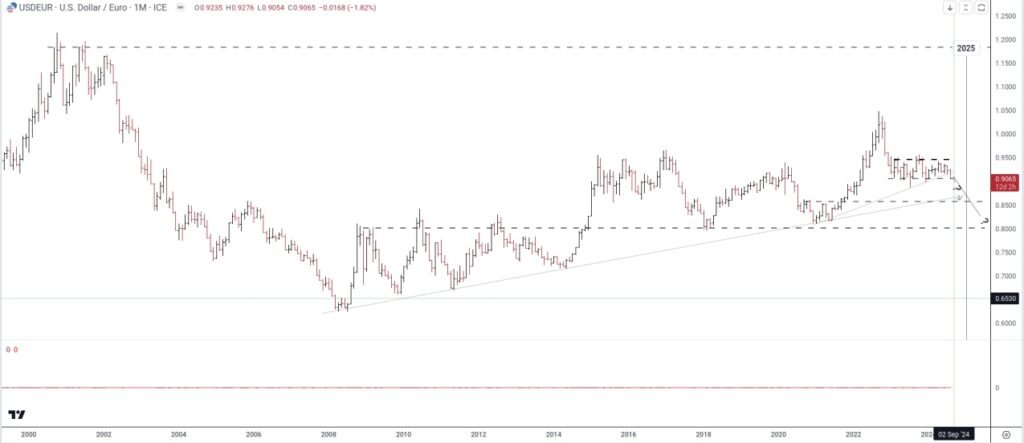
The USDEUR closed the week down and is starting to look more bearish, confirming a lower low since the beginning of March 2024. This dollar weakness might have helped the stock market to stay bullish. A weaker dollar generally makes US exports more competitive and can boost corporate earnings, which in turn supports higher stock prices.
Conclusion

In summary, the US market is currently in a phase of strong recovery and resilience. The SPX index’s approach to its ATH and the bullish trends in gold and silver are key indicators to watch. Investors should stay vigilant as the market navigates these critical levels, which will likely set the tone for future movements. The interplay between sector performance, commodity prices, and the dollar’s trajectory will be crucial in shaping the market’s next move.

Best Regards.

Posted in Blog | Leave a comment

US market 2024 May

Trading requires intense personal involvement.
You have to do your own homework, and that is what I advise people to do.


May 01, 2024 / Wednesday / EOD

NDX – Yesterday’s down bar currently suggests a bearish outlook. (Seven hours remain before the session closes.)

Today, The Fed will reveal its interest rate decision, though people believe it will remain the same with 99% certainty (source: CME FedWatch Tool ).

The market is the strictest employer. It doesn’t forgive you for taking days or weeks off. It doesn’t like you to go on vacation. No union, no guaranteed paychecks. It doesn’t care if you get sick or have a baby. It doesn’t forgive you for not doing your homework and being unprepared. But… when you spend years studying its habits and earn its respect, the market will pay you well.

May 13 2024, Monday. (2 hours left to the session)

Since the low of April 19, 2024, the financial market has been on a rollercoaster ride. The market began an upward wave, only to face selling pressure on April 29, 2024. This day marked a turning point, with the following two days exhibiting bearish tendencies, particularly noticeable in their increased volume. However, the subsequent day closed on an upward note, though not strong, which looks surprising.

From a bullish perspective, this upward turn appears quite logical. This is the first significant correction since December 2023, and given that the major trend is upward, the initial assumption would be that the trend will continue unless substantial selling demonstrates its strength or the market becomes weak and buyers can’t push higher. As of now, there is no evidence of solid selling, although some market weakness is observable.

By the end of the week, the market seemed somewhat exhausted, but it remains unclear whether this fatigue is sufficient to trigger a downturn.

It’s also important to consider that the market’s behavior of creating local bottoms and highs and its approach to KL may change due to a shift in players’ strategies, reflecting a changed environment, such as higher interest rates. However, it’s still uncertain whether this is the case. In such a scenario, only the big picture matters, and the rest is merely noise.

In conclusion, the market’s recent behavior has been a mix of ups and downs, with some signs of weakness but no clear indication of a significant downturn. As always, it’s crucial to keep an eye on the bigger picture and not get lost in the noise. The market’s future direction will depend on a variety of factors, including interest rates and the strategies of market players. As we move forward, it will be interesting to see how these factors play out and shape the market’s trajectory.

May 16, 2024 EOD

As we move into the second half of May, it’s an opportune moment to reflect on the market’s performance so far. The month began with a brief selling phase on May 1st, but a turnaround quickly followed this. On May 2nd, the S&P 500 (SPX) reversed course and began an upward trajectory. Remarkably, every subsequent daily bar in May has closed either higher or at the same level as the previous day, indicating a strong and consistent upward momentum.

The most notable milestone came on May 15th, when the SPX closed at an all-time high (ATH), resuming its uptrend. This performance underscores the market’s resilience and the bullish sentiment among investors.

As we continue through May, it is important to monitor whether this upward trend sustains or if any significant corrections emerge. For now, the SPX’s performance in May has been robust, setting a positive tone for the weeks ahead.

Posted in Blog | Leave a comment

US market 2024 April

Trading requires intense personal involvement.

You have to do your own homework, and that is what I advise people to do.


LAST UPDATED:

April 21, 2024, Sunday.

April 13, 2024, Saturday

Never confuse brains with a bull market.

SPX – The last week is closed down, making the second down bar in a row and it happened first time since October 2023. So, sellers prevail and it opens the possibility of testing the 4,810 level, the previous historical high. This is what the weekly picture shows. Another interesting detail is that last bar low is lower than the bar before, and this is the first time it has happened since January 02, 2024. SPX 2024

Daily, there are some interesting observations to note as well. So it seems that players lost the enthusiasm they showed on March 20’24, when they resumed the up trend. They probably were inspired by the FED’s recent interest rate decisions. The obvious supports here are: 5050, 4,930 and the major one is 4,810 (clearly visible on the weekly picture).

NDX – closed last week down as well, though it still keeps its current trading range of 17,790 – 18,340. NDX 2024


April 15, 2024, Monday (EOD) 

The US market wrapped up today’s trading session in the red, which, let’s be honest, isn’t exactly a shocker. Let’s wait when and where it stops this downward move.

Today’s reading: Easy Money (Memos from Howard Marks)

10YR Bonds Yeld reached an interesting key level (KL) BONDS 2024

Gold – is it trying to absorb selling?


April 17, 2024, Wednesday (EOD)

SPX declined further, breaking the key level of 5,050 and closed nearly at 5,000.
Let’s watch if THEY is going to dance around there. Also, I am eager to see if it reaches 4,800 and how.
NDX broke down 17,800 and shaped confirmation of the new lower low on the weekly picture.

Bonds turned down bouncing from obvious key levels. BONDS 2024

CRYPTO – Bitcoing is halving coming days
Bitcoin is about to hit an event called the halving — and it may spark a huge rally


April 21, 2024, Sunday

Bitcoin underwent a halving last Friday. According to various sources, this is bullish news, which is encouraging. The future trajectory of Bitcoin will become apparent in the coming days, weeks, or even months. However, it is crucial to examine how it has performed in the past and attempt to extrapolate this to current trends.

Bitcoin has been halved several times. However, I believe it is essential to identify the point at which it gained recognition and began to be traded by the general public. From this point onwards, I hypothesize that Bitcoin speculation can be considered as more or less adhering to the same laws and rules applicable to other financial instruments such as stocks, commodities, and currencies. Therefore, I will attempt to apply the same set of rules here.

Initially, I observed that it had been on an upward trend until mid-March 2024, when it began to shape a trading range between 60,600 and 74,000. Interestingly, Bitcoin got back and danced with historical highs of April and November 2021. Therefore, it returned to these historical highs after three years. The current trading range has lasted six weeks so far and shows mixed signals.
Sellers started to pressure Bitcoin in mid-March 2024, driving it down to the 60,600 level, where the public considered it a good time to buy, bouncing Bitcoin back to the selling zone around 72-74,000. At the end of March, buyers attempted to absorb the selling, but they lacked the strength to maintain it there, and a new selling wave began on April 2, 2024. It returned to the selling zone on April 08’34, which was a selling retest. After that, it wasn’t surprising to see Bitcoin return to the 60,600 support level, where it danced until the “halving news” came. The coming days will reveal the extent of bullish sentiment there.
Some consider Bitcoin a safe haven during this period of uncertainty. Well, I don’t think that it can be used as such without THEM tricking you into thinking something else. However, this is my pure speculation about the currents, and the price will tell us soon what is about to happen.

BR

Posted in Blog | Tagged | Leave a comment